
Today I tweeted this:
Your “tiny” CSS animation might be burning CPU 24/7.
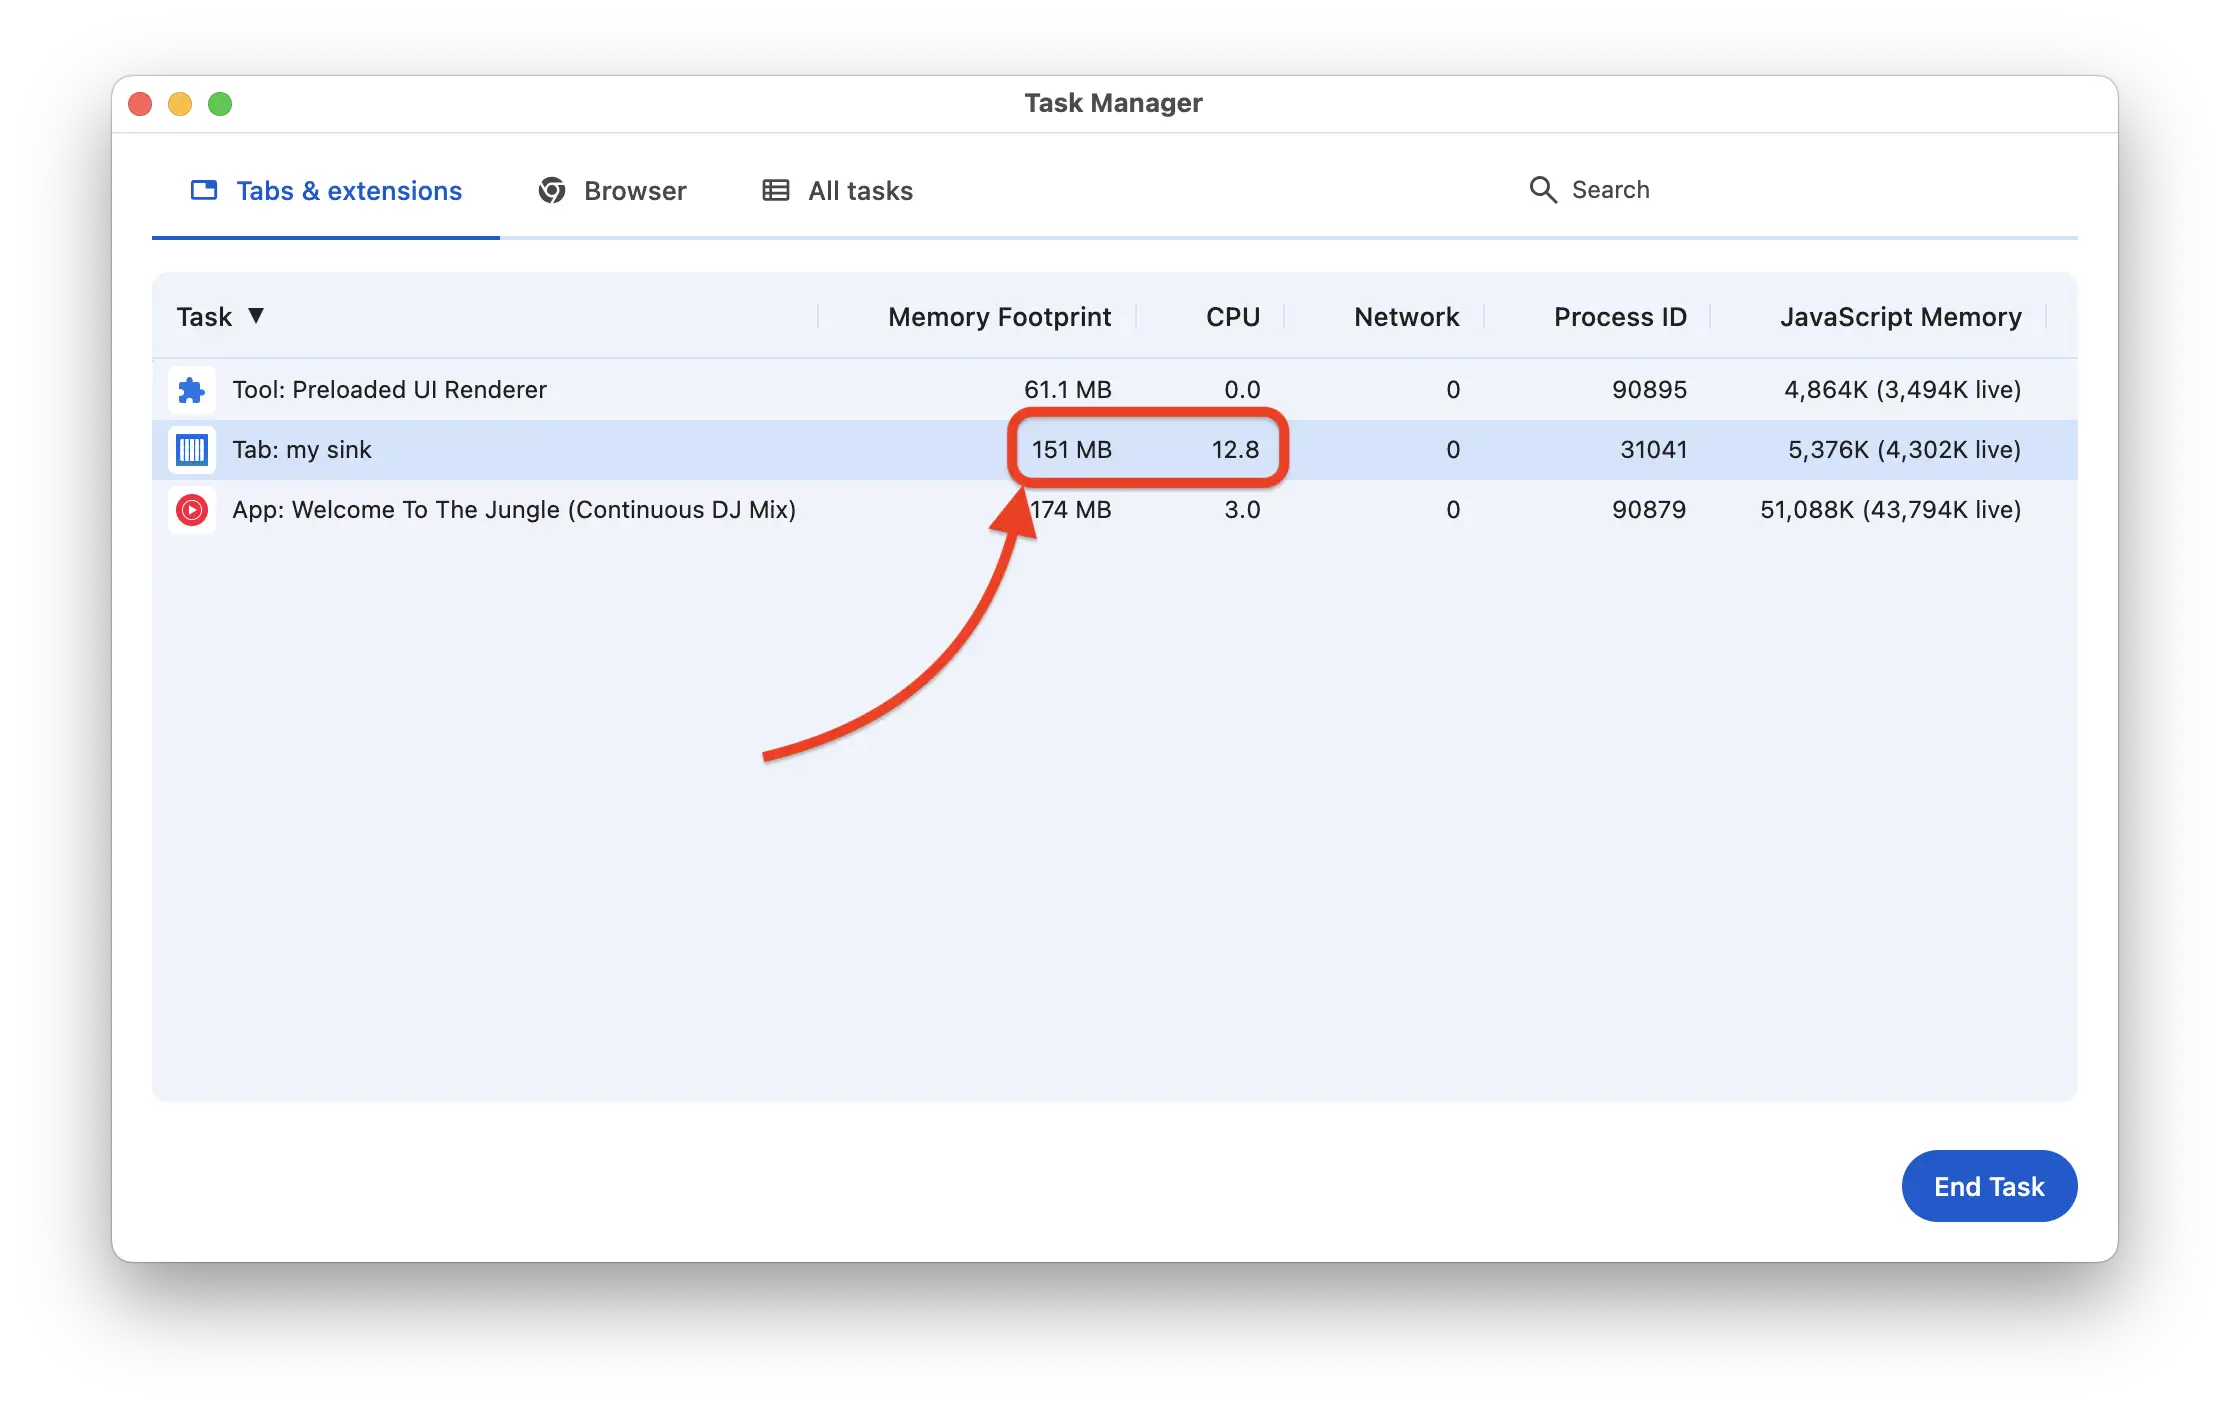
My dashboard sat at 10-15% CPU nonstop. The culprit was a harmless-looking "loading dots" animation.
I replaced it with plain … (…) CPU dropped to ~0-1%.
Bottom line: animations are NOT free.
What I didn’t say in the tweet is how long it took me to find the real culprit.
The mystery
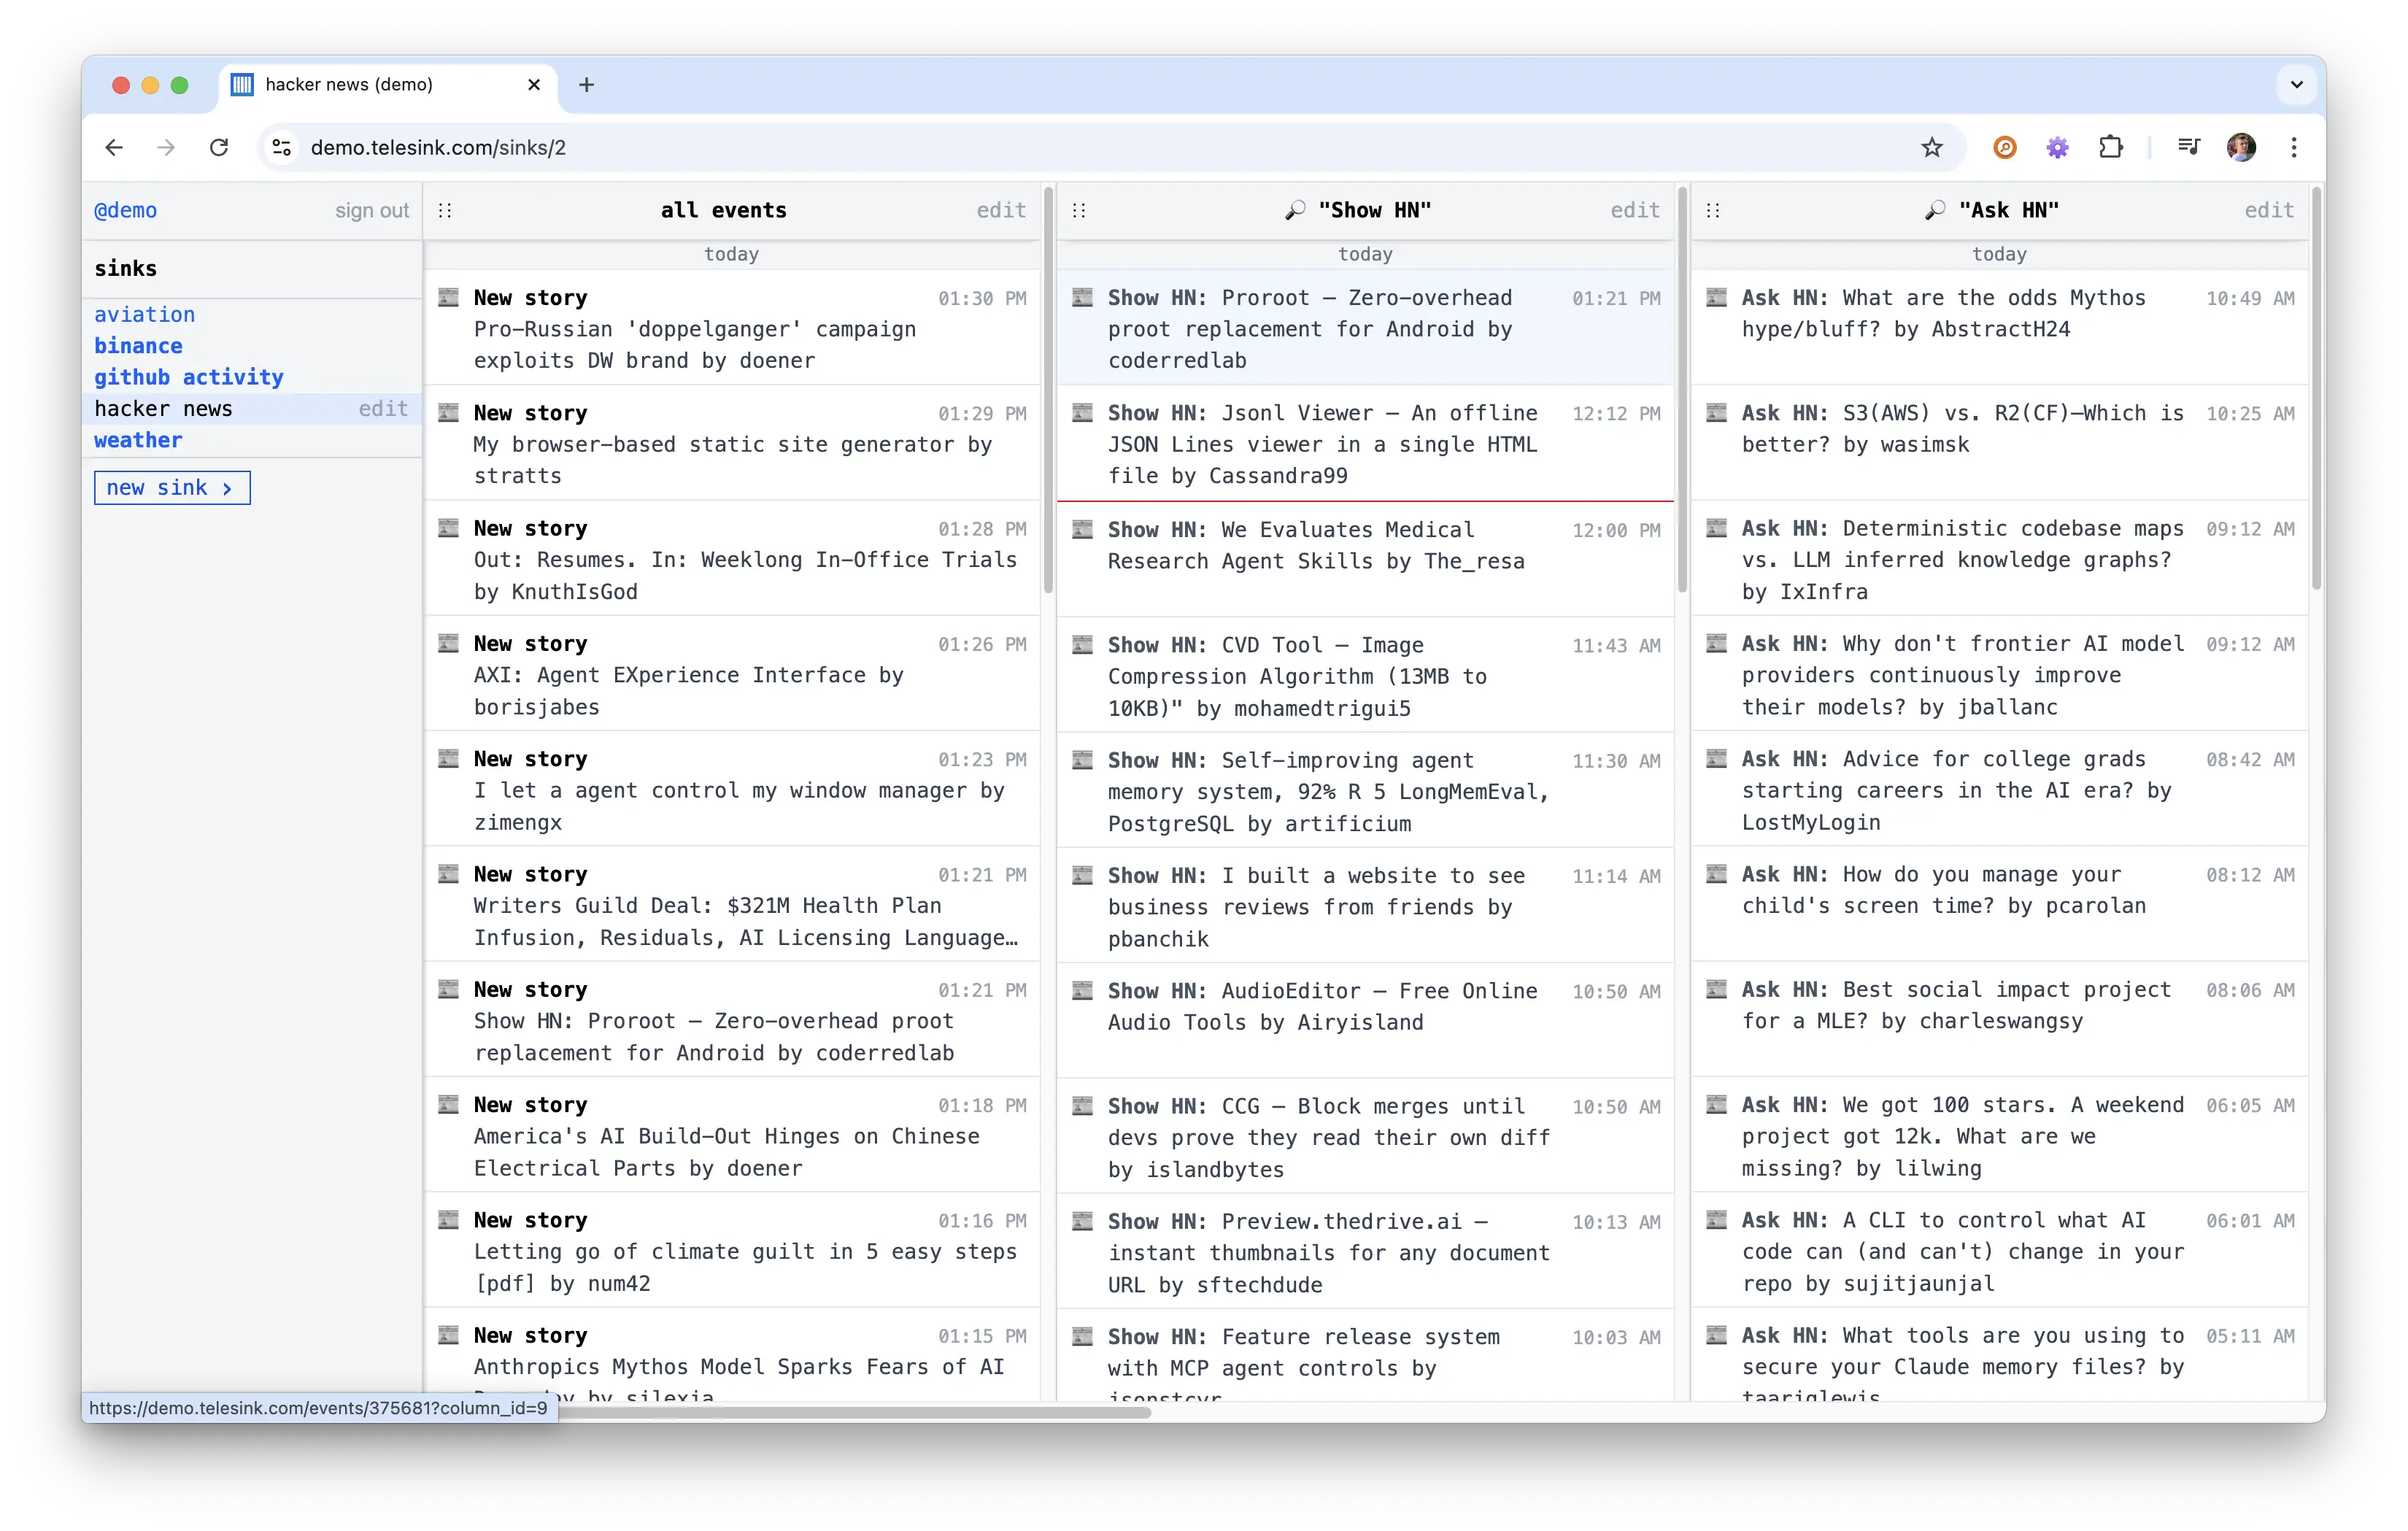
Telesink dashboard with several columns of live events.
I had been watching the Telesink demo dashboard for weeks and noticed something odd. Even when nothing was happening, the CPU usage on the page stayed consistently high: 10-15%. Other pages and other dashboards I opened stayed cool.
I immediately suspected the usual suspects in a real-time dashboard: the JavaScript that watches for new events arriving live, the code that manages each column of events, or the system that updates the page without a full refresh. So I started optimizing.
Profiler before the fix, with constant style recalculations even when idle.
I simplified a lot of the live-update logic, moved some date labels to the server, and cleaned up the JavaScript that powers each column. All good changes, but the CPU barely moved. I was confused.
What Telesink is supposed to be
This bothered me more than it should have because Telesink is supposed to be lean. It’s a real-time event dashboard that should feel instant and lightweight, not like it’s secretly mining bitcoin in the background.
The whole point is to give you a calm, clear view of what’s happening right now, without wasting your laptop’s battery or making your fans spin up.
Every single thing has to justify its existence. If it doesn’t pull its weight, it goes. That is the same principle behind Why Telesink Uses a Text-First UI.
The real culprit
The animation that was killing performance was this:
.loading-dots:after {
  animation: loading-dots 2s steps(5, end) infinite;
}

@keyframes loading-dots {
  0%, 20% { content: "."; }
  40% { content: ".."; }
  60% { content: "..."; }
  90%, 100% { content: ""; }
}
It was sitting in the “loading older events” indicator at the bottom of every column. That indicator stays in the page forever, so the animation ran 24/7.
Changing the text with steps() forces the browser to do
expensive layout and repaint work on every tick. Even when you’re not
looking at it.
The pragmatic fix
I replaced the whole thing with a static ellipsis:
↓ loading older events…That’s it. No animation.
We almost never see this text anyway. It only appears for 1-2 seconds when you scroll down to load older events. The animation added zero real value but cost real CPU the entire time the page was open.
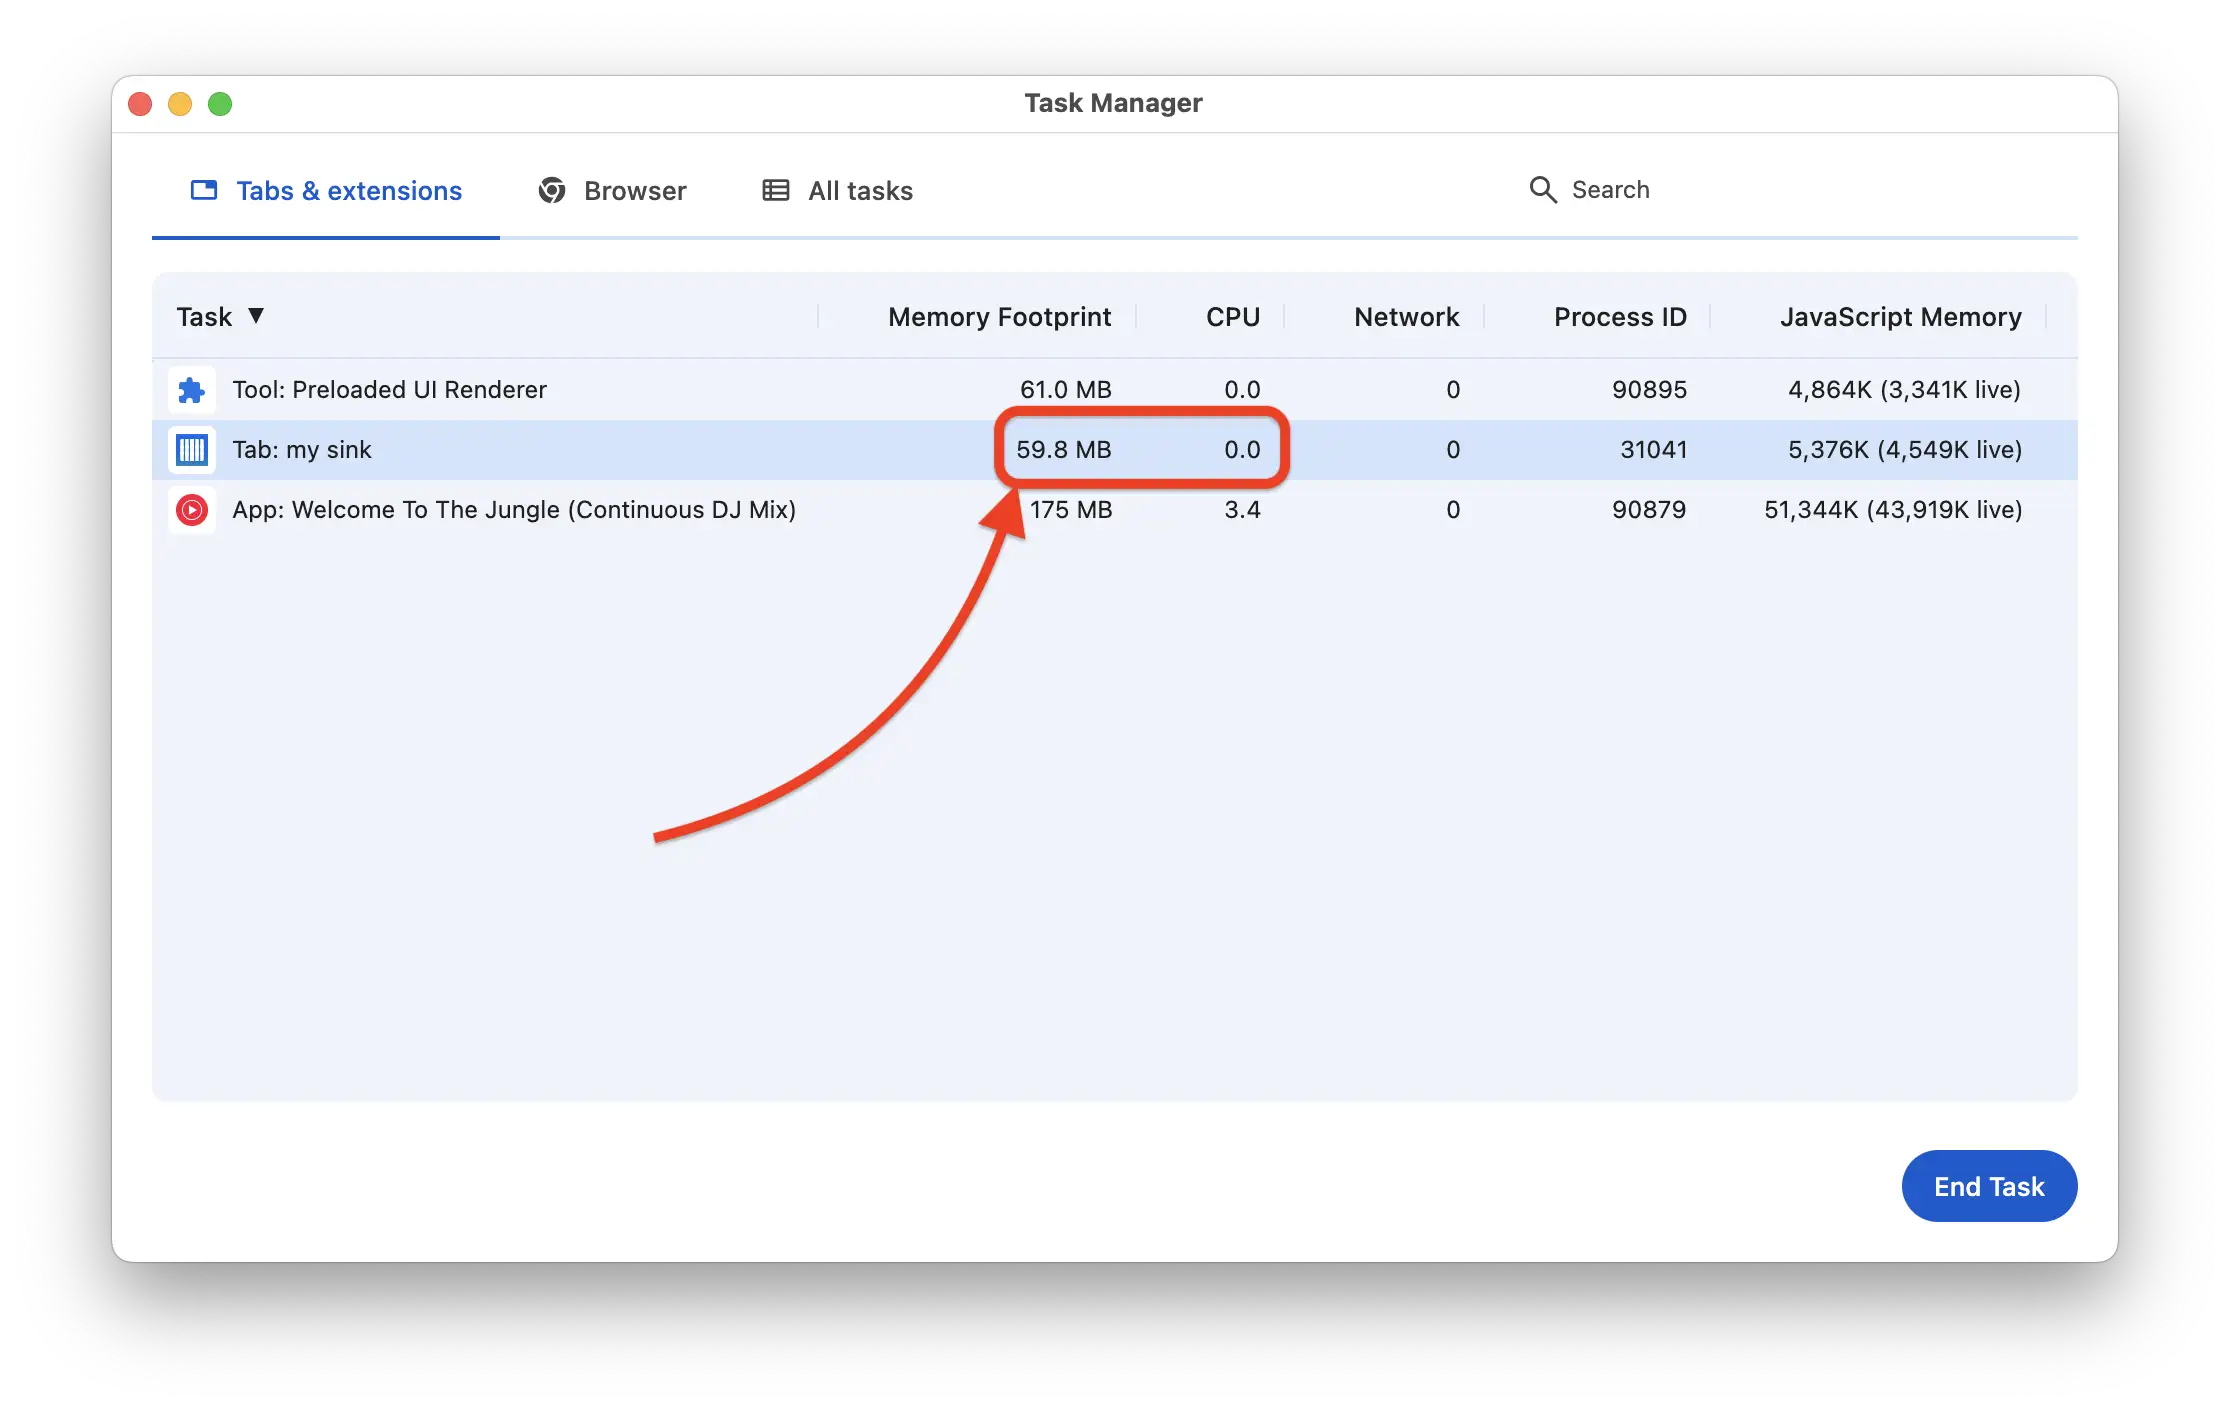
Before vs after, with the same page and the same events.
What we won
CPU usage on the demo dashboard is now ~0-1% when idle. The page feels noticeably lighter. Fans stay quiet. Battery lasts longer.
More importantly, it reminded me why I’m building Telesink the way I am: every single thing has to justify its existence. If it doesn’t pull its weight, it goes.
Small details matter. Especially when you’re building something that’s supposed to run quietly in the background of your day.
If you want a real-time dashboard that respects your CPU (and your battery), try the Telesink demo. The full open-source version is free to self-host on GitHub.
Less decoration, more signal.